A desktop application for the FlightGear flight simulator, used to fly an aircraft using a stream of data given as a CSV file by the user.
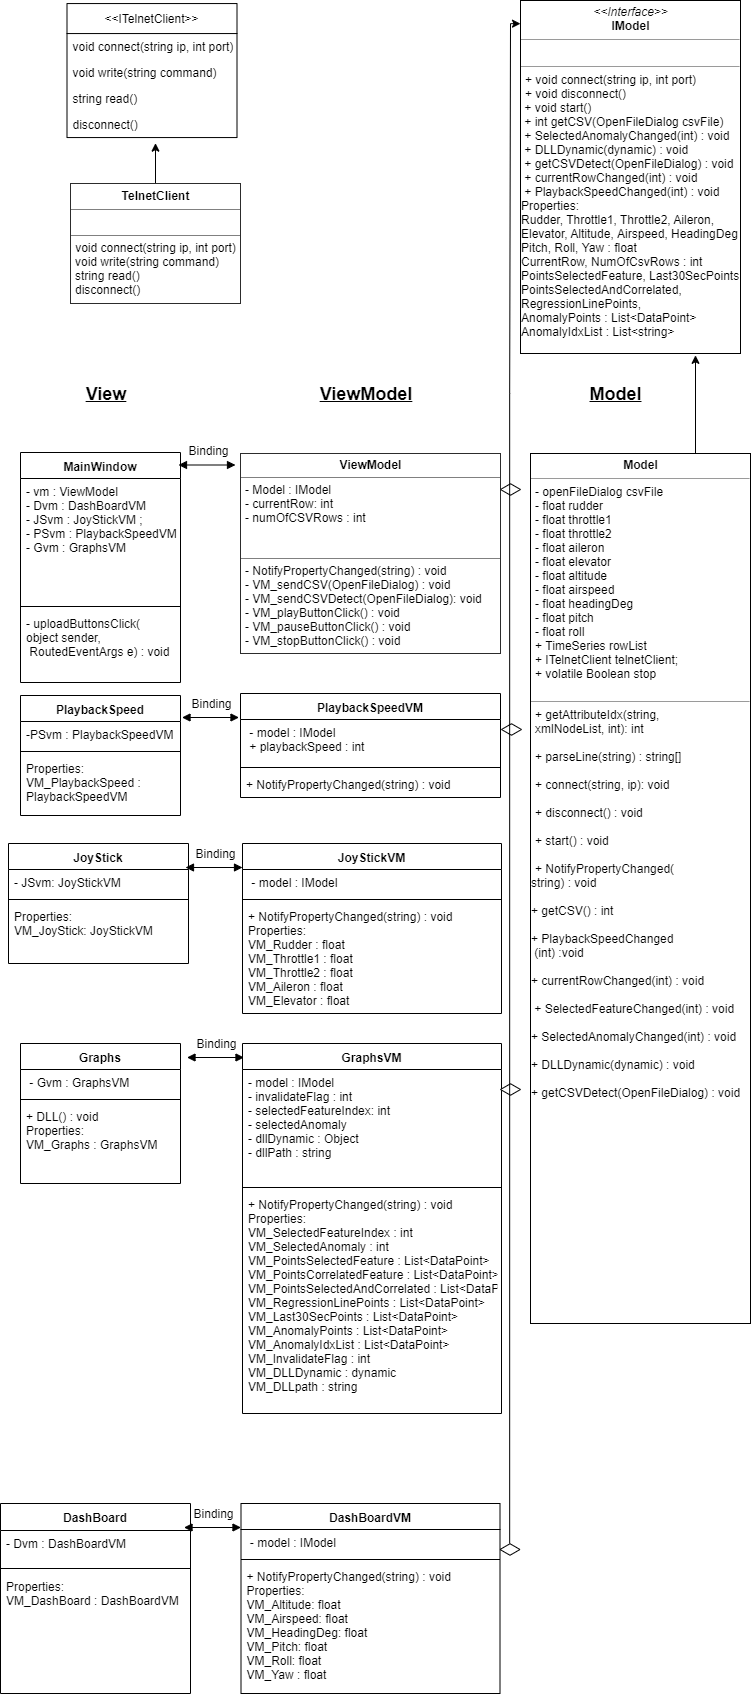
Implmented using WPF technology and MVVM architecture.
- Download and install the simulator on your computer- https://www.flightgear.org/download/
- Add the playback_small.xml file to the /data/Protocol directory where you installed the simulator
- Config the following settings in the 'Settings' tab in the simulator:
--generic=socket,in,10,127.0.0.1,5400,tcp,playback_small
--fdm=null
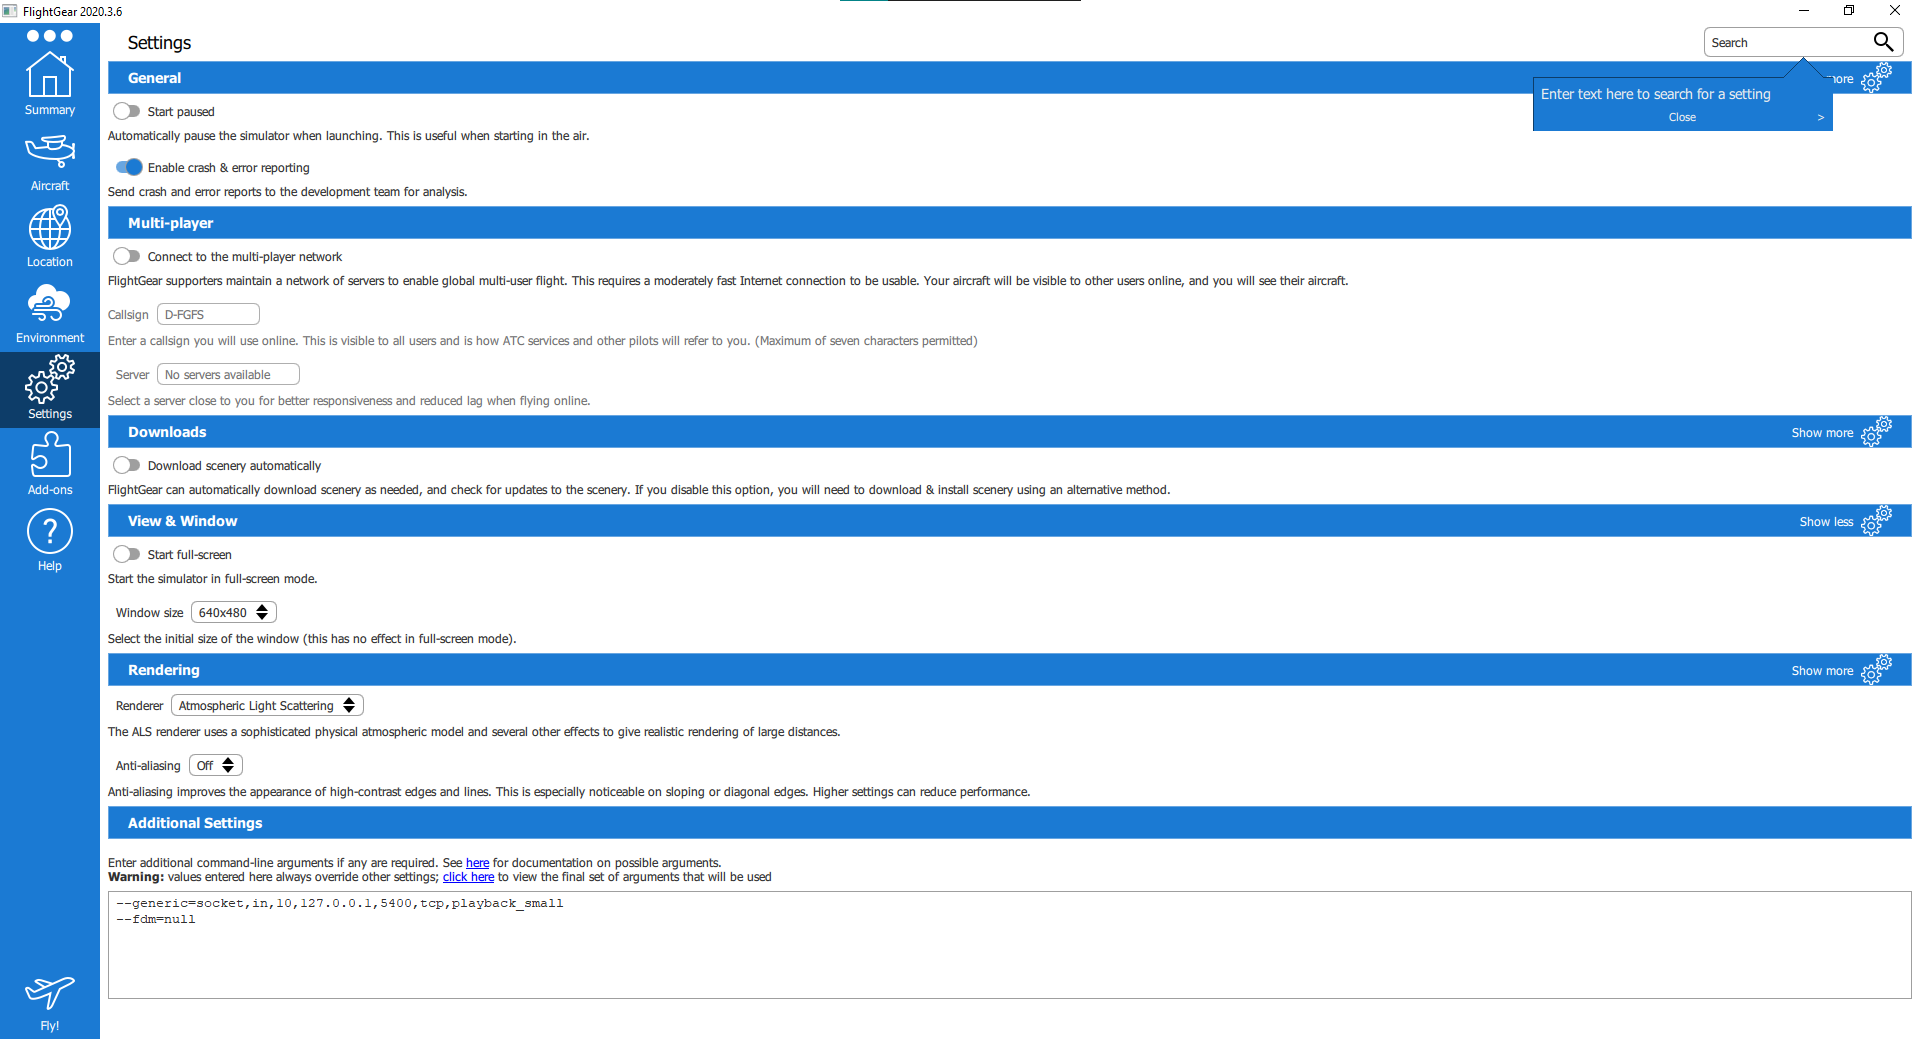
This will open a communication socket for sending data to the simulator.
On startup, the main window will be presented:
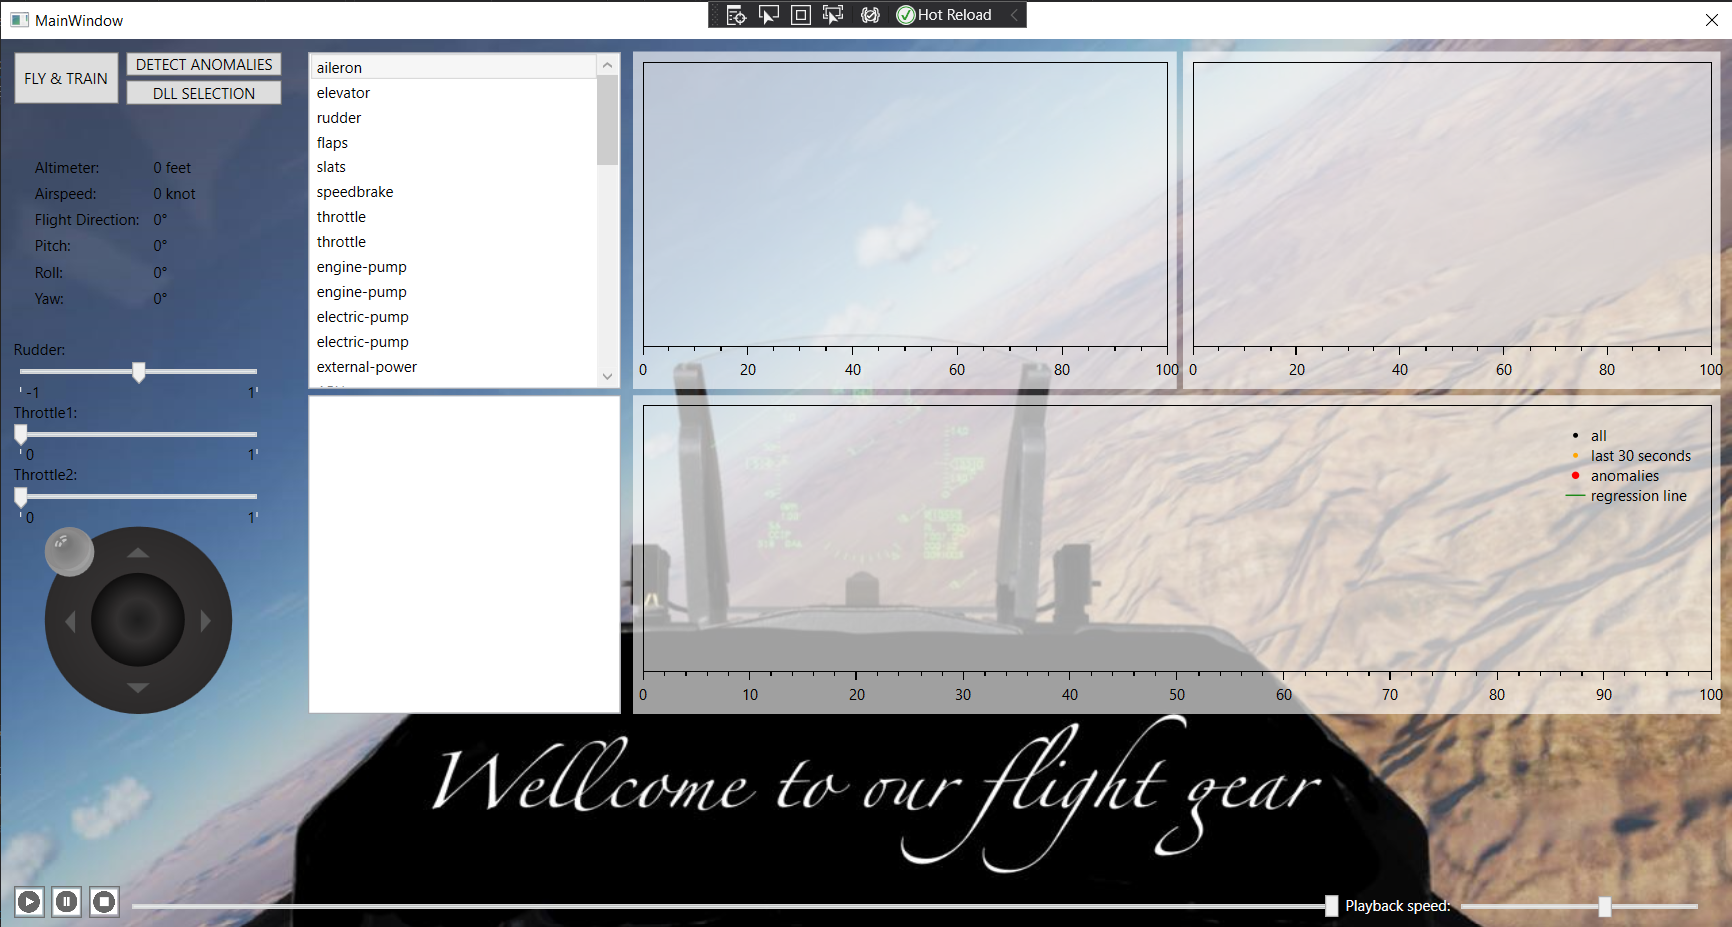
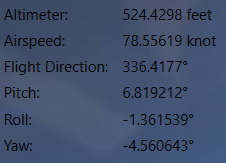
This is the window which will be used in order to control the simulator: The right-hand side is a live updating multiple graphs for each data member according to the data of the flight. You will also find in the left side the data of the dashboard of the plane e.g. the altimeter/airspeed/flight direction/pitch/roll/yaw. The left-hand side shows the status of the controllers of the plane, e.g. the Joystick and the rudder/throttle data.
You can watch a tease of using our application in the link: https://youtu.be/yXAhb6EBY04
There are 9 main features of our simulator:
First, run the simulator, click on the 'Fly!' icon in the bottom left corner. The aircraft flight is being dictated by the CSV file uploaded in the main controller window and shown to the user, Therefore click on it and upload the wanted flight file. Make sure the playback_small.xml file is in the right place with the right headlines for the CSV.
After uploading the CSV file, when you're ready to fly- fasten your seatbelts and click the PLAY button on the playback bar:

Using the playback bar you are able to control the exact playback speed in which the flight will be executed. Further more you can use the bar below to reset/stop/continue the flight and change the location of the bar pointer to jump to a specific time in the flight.

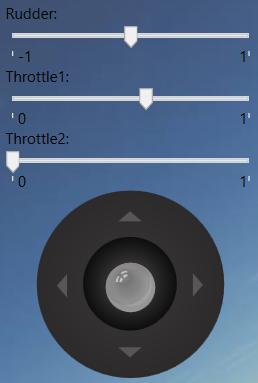
In the buttom left side of the application, you are able to view all the main rudders with their current values updated by time. You can view the rudder value and the two throttles values with sliders that indicate their values. For the aileron and elevetor values you can view the joystick- its up and down motions indicates the elevator value and its left and right motions indicates the aileron.
When watching the simulator you can choose to watch some parts faster and other parts slower. The default speed is 10Hz. Move the playbackspeed slider in the buttom of the application- right for faster and left for slower.

You can also view other data values of the flight- altimeter, airspeed, flight direction, pitch, roll and yaw. In the left side of the application you can view all the exact values of this parameters changes by time.
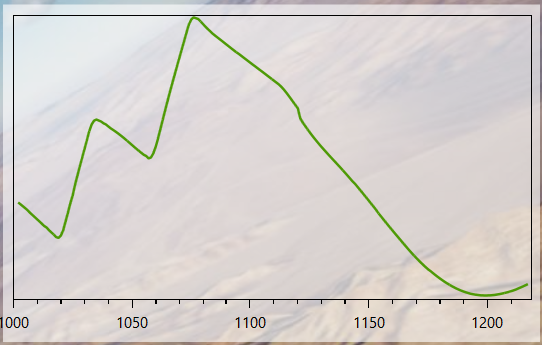
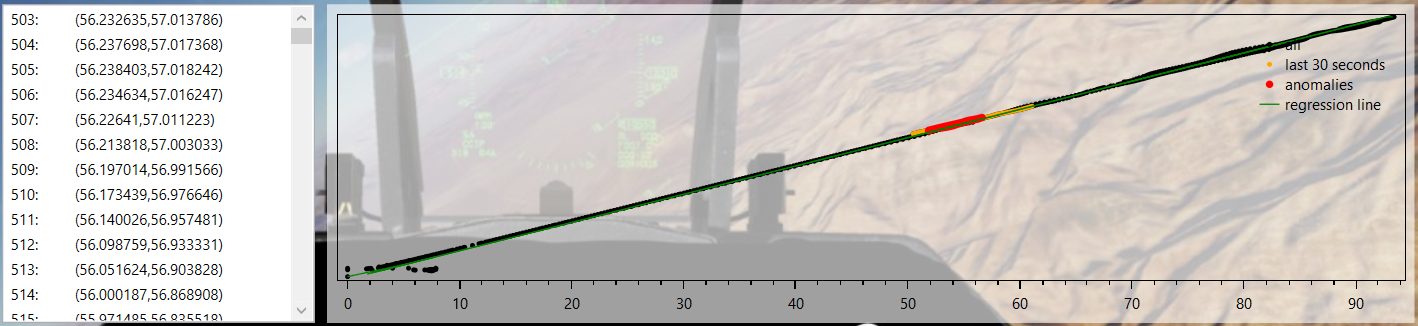
Right in the middle of the appliction you can choose any feature you want from the list and view its graph. The X axis indicates the time and the Y axis indicates the value of the chosen feature. The graph right next to the list will be the graph of the feature you chose.

Pay attention to read the feature above. The right graph in the top will display the most correlated feature for the feature you chose from the list. Notice we set no minimum for a correlation- the best correlated feature will be displayed and will be defined as the correlated feature. The X axis indicates the time and the Y axis indicates the value of the most correlated feature for the chosen feature from the list.
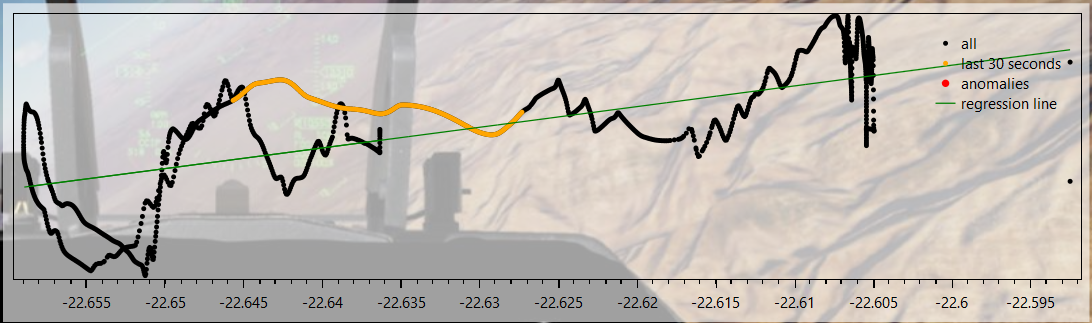
Pay attention to read the two features above. In the next graph you are going to view the regression line of the two features (the feature which is chosen from the list and its most correlative feature). The green line in the graph indicates of the regression line The black points in the graph indicates both the chosen feature and the most correlative feature points. The orange points in the graph indicates the points of the last 30 seconds of the flight- you can enjoy watching it move with time. An explanation of the red points is in the feature below.
Pay attention to read the three features above.
You can choose to add another CSV file and detect anomalies.
The first CSV file you uploaded will be the train file and the next CSV will be for detect anomalies in it.
Pay attention there is no default algorithm for detecting anomalies.
You will also need to upload a .dll file of the algorithm you will to use.
In the plugins folder you can use one of our two .dll files- FirstDLL is for detecting anomalies using regression line and SecondDLL is for detecting anomalies using a circle.
You will need to upload the .dll file to the appliction.

Our application will use the .dll file and display the anomalies returned from the .dll. You can view the anomalies in the exact same graph from the feature above- the anomalies are in red points.
Notice! To make it easiear following the anomalies, the list in the left side of the graph will display the time of the anomalies and the anomaly itself. You can choose an anomaly from the list and go to the exact time the anomaly has happened in the flight.
Enjoy your flight!