A server side SVG chart library.
This project started as I had a requirements to generate charts in the background, which could be embedded into a PDF document. The only solutions I found relied on either a JS rendering engine or a reporting engine like Crystal or Reporting services. I wanted a solution to generate charts, which was HTML compatible without using any front-end technologies or fancy libraries.
This project uses only System.Drawing to generate a SVG output, which could be embedded into html, styled with CSS and then embedded into a PDF.

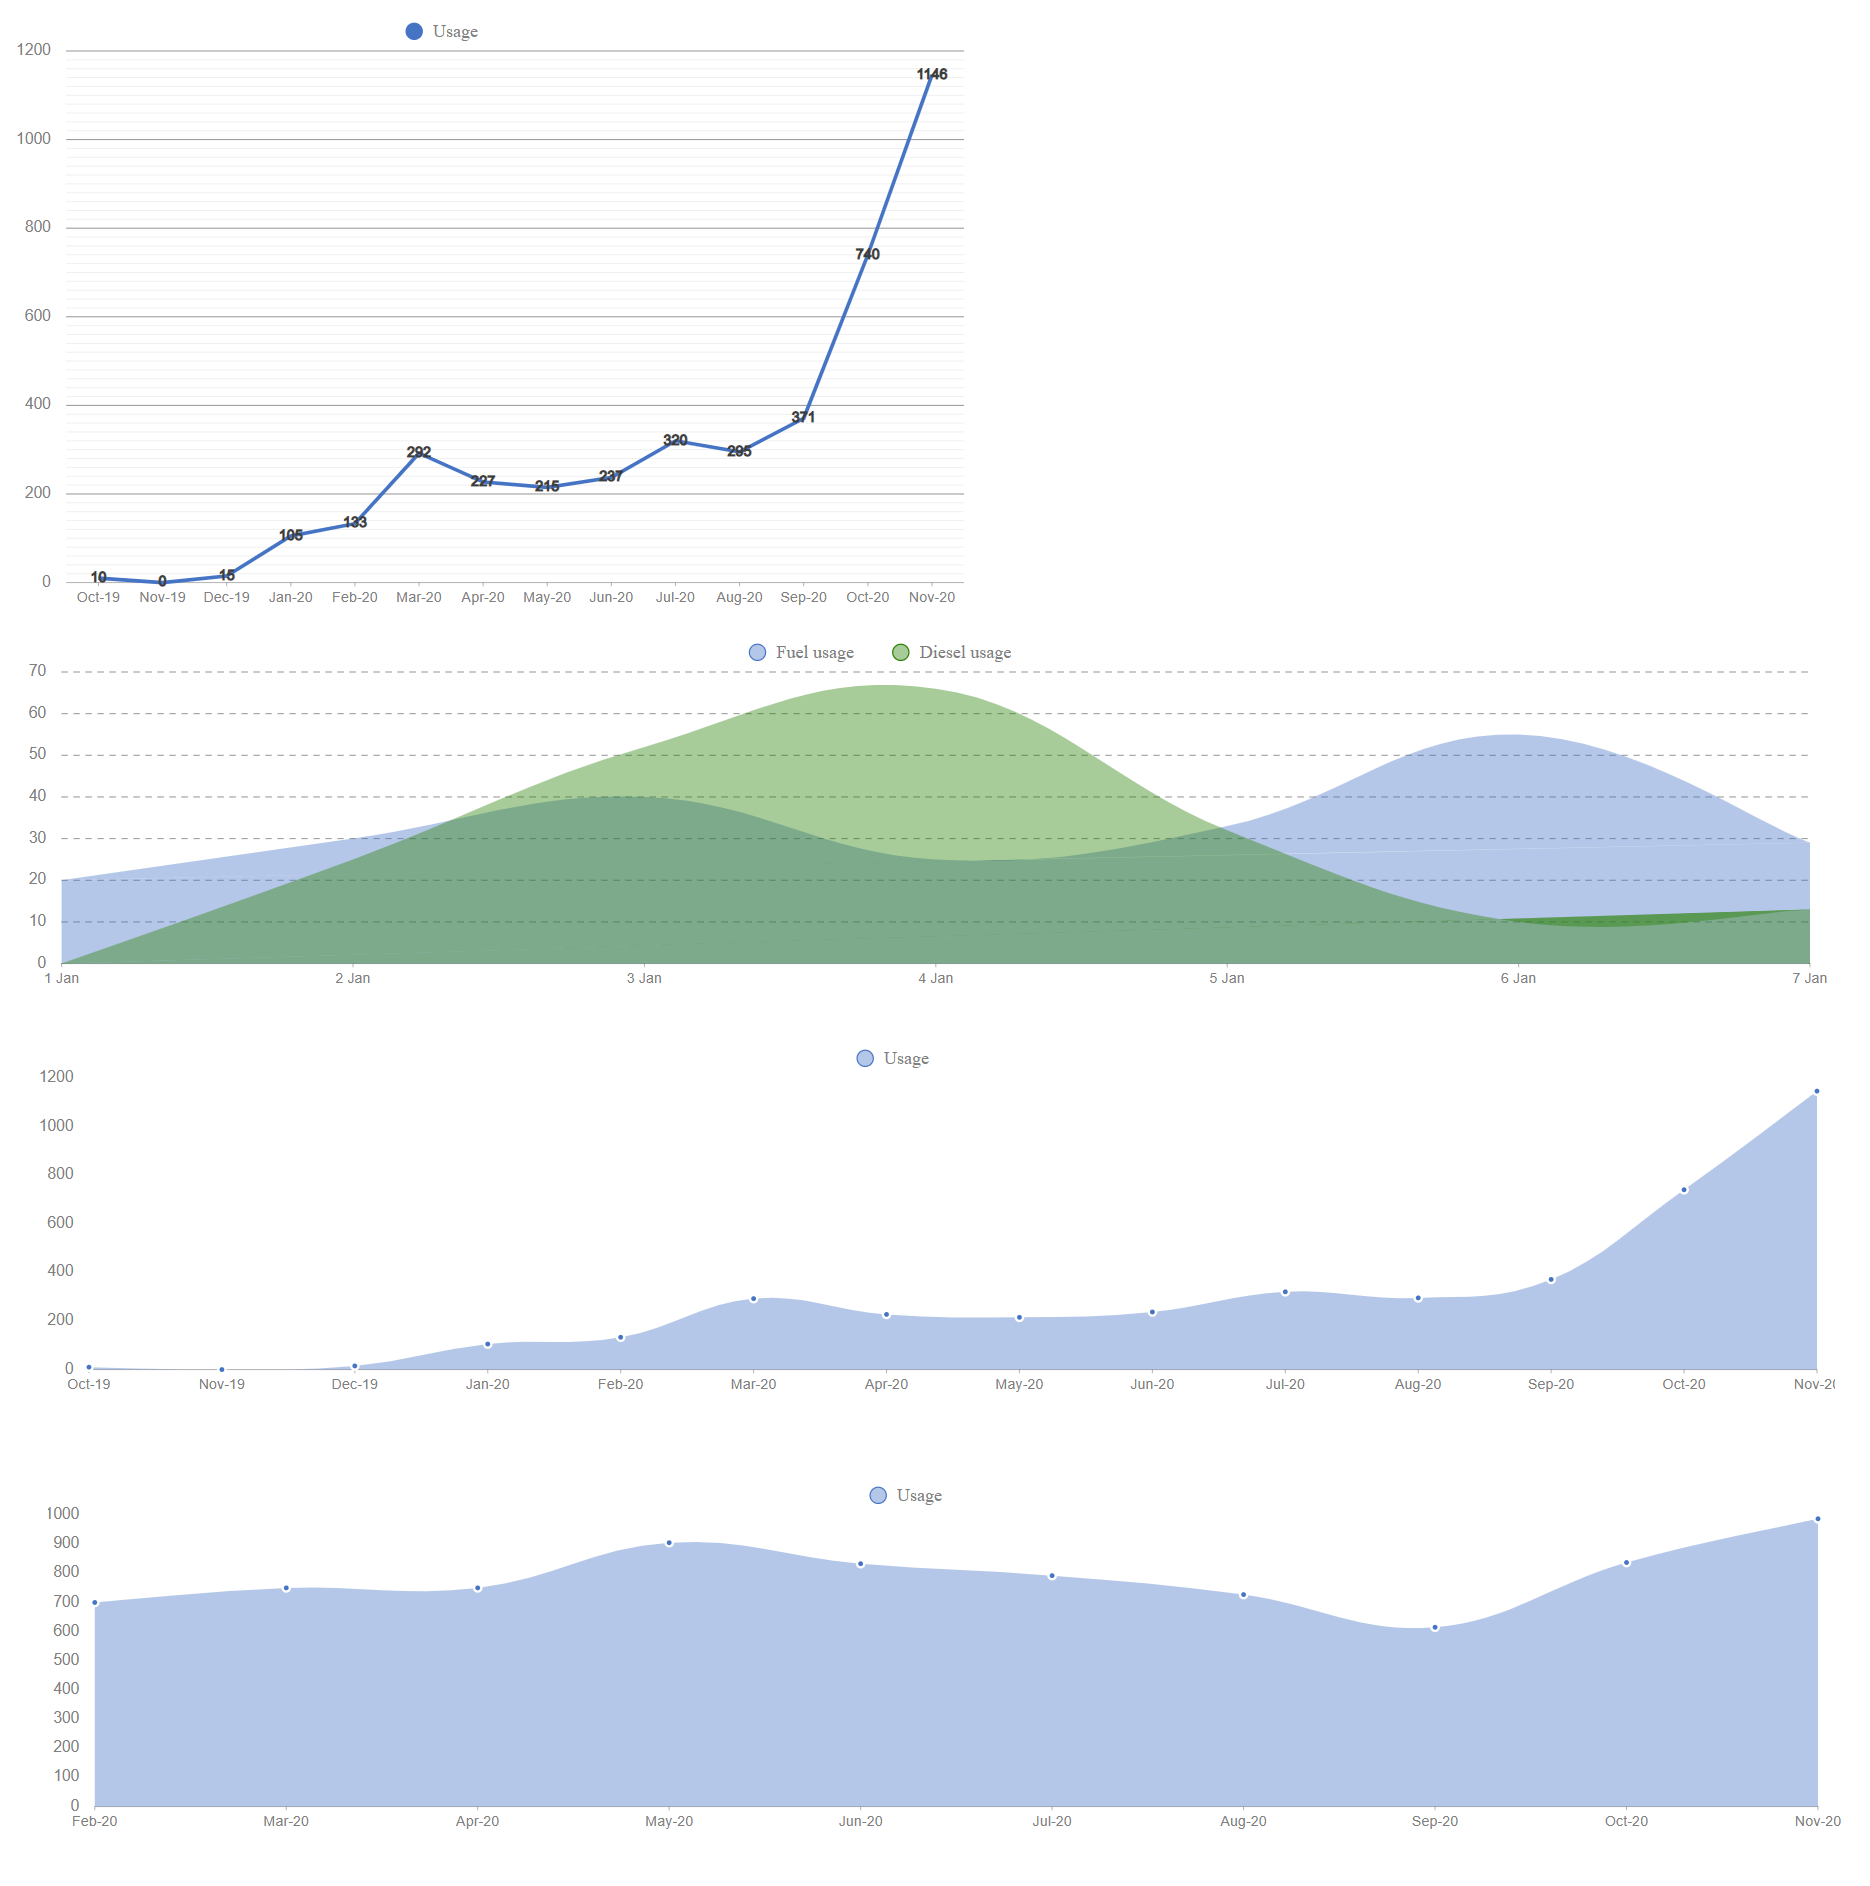
Take note that this project is a WIP and currently only line charts are supported
- add bar charts
- allow charts to have a mixture of straight line, curved line and bars
- add pie charts
- add doughnut charts
- allow changing legend position
You can generate a chart with default options using the following code :
var series = new[]
{
    new ChartSeries("Series1", new[] {10.0, 0, 20, 25, 5, 60, 30 })
};

var labels = new[] { "One", "Two", "Three", "Four", "Five", "Six", "Seven" };

var chart = new LineChart(series , labels )
{
    Height = 500,
    Width = 800,
};

var xml = chart.ToSvg();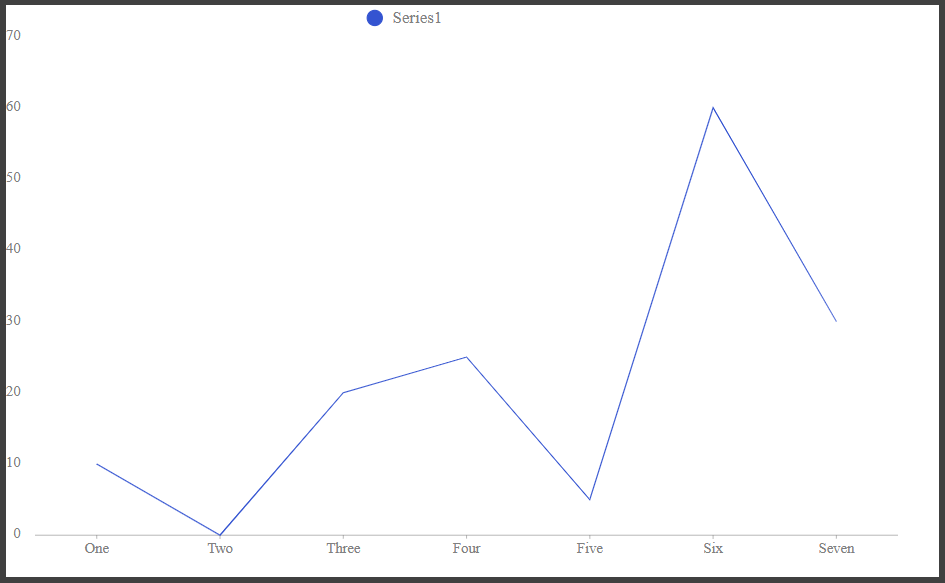
Consult the Customization guide for information on customization options.