AzurePlot plots metrics from various Azure services. It's designed to be a better alternative to the native charting/monitoring capabilities of the Azure portal, focusing on usability and performance. It works by accessing the APIs provided by the individual services.
If you're operating applications running on Azure and occasionally need to diagnose problems, this tool is for you.
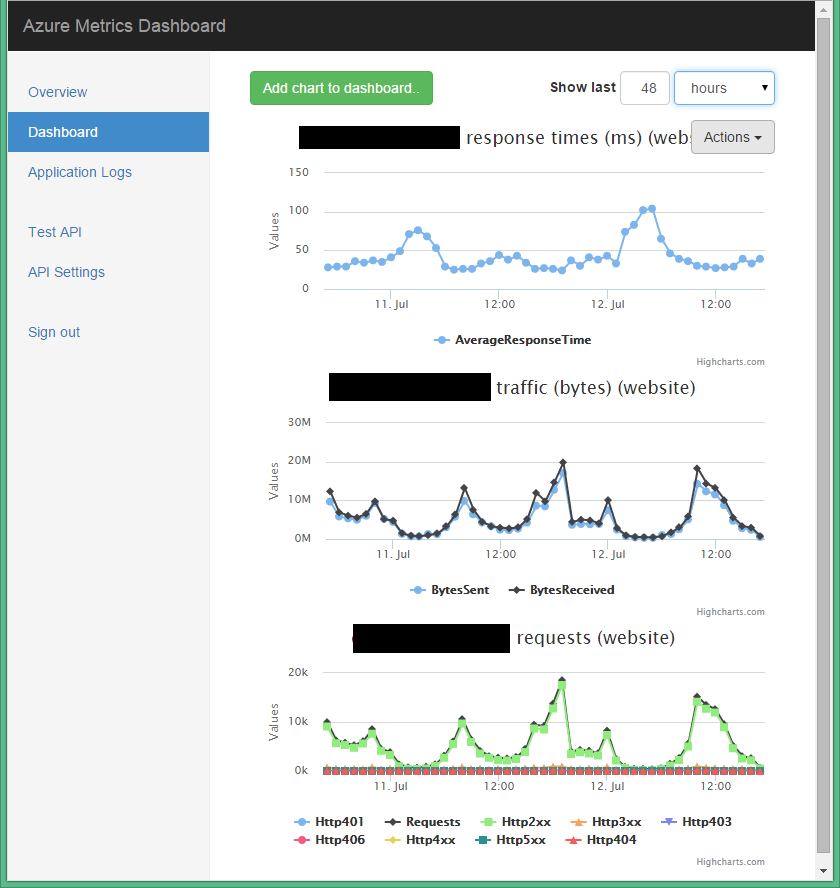
- Chart metrics from Azure Web apps (formerly Windows Azure Websites), Web/Worker roles, VMs and SQL Database
- Dashboard for displaying multiple charts
- Beautiful Highcharts based charts
- Very easy to setup
- Bootstrap based GUI
- Expose metrics through an API
- Integrated API test tool
- Integrated log viewer to quickly diagnose problems
- Can run on any IIS web server including Windows Azure Web Sites
To run AzurePlot you will need to have Visual Studio (>=2012) installed on your computer.
Clone the solution and open AzurePlot.sln in Visual Studio. Build the solution and start the AzurePlot.Web project. This should start an IIS express instance and run the app on http://localhost:49758/. Point your browser to this address and you should be greeted with the following page:
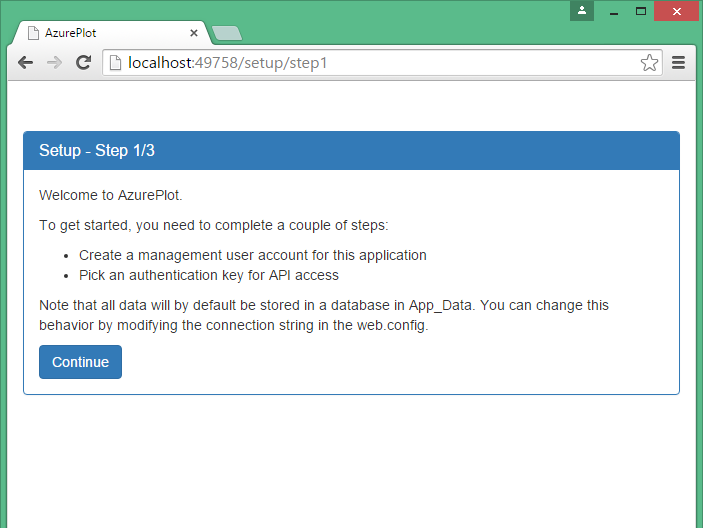
This is a wizard that will guide you through the process of setting up a username and password. Once you've done this and logged in you'll arrive in the the service overview screen. This screen lists all configured services, and it allows you to add new services:
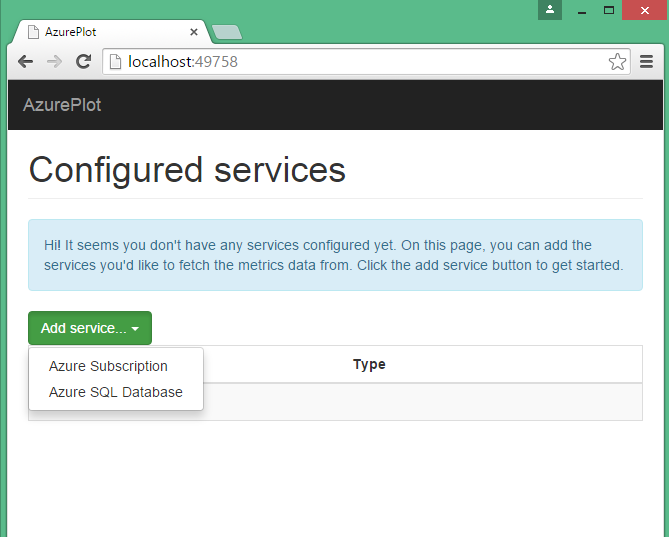
At this moment Azure Subscriptions (providing metrics for web/worker roles and websites) and Azure SQL Database are supported. In this guide we'll only cover adding an Azure Subscription, but adding a SQL Database is similar.
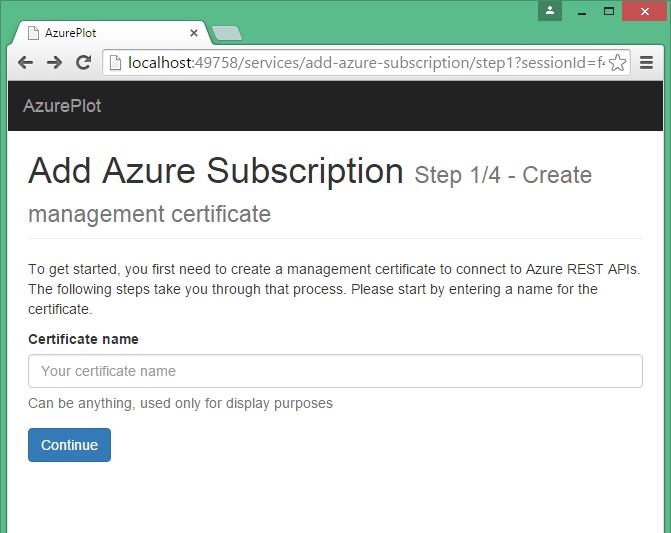
You'll enter a new wizard for adding an Azure subscription:

You'll first need to pick a Certificate Name, this name will be used for display purposes so you should pick something descriptive.
A new certificate will be generated. Download it to a temporary location.

You now need to upload this management certificate to the Azure portal. To do so log in to the portal and go to Settings -> Management Certificates and click Upload.
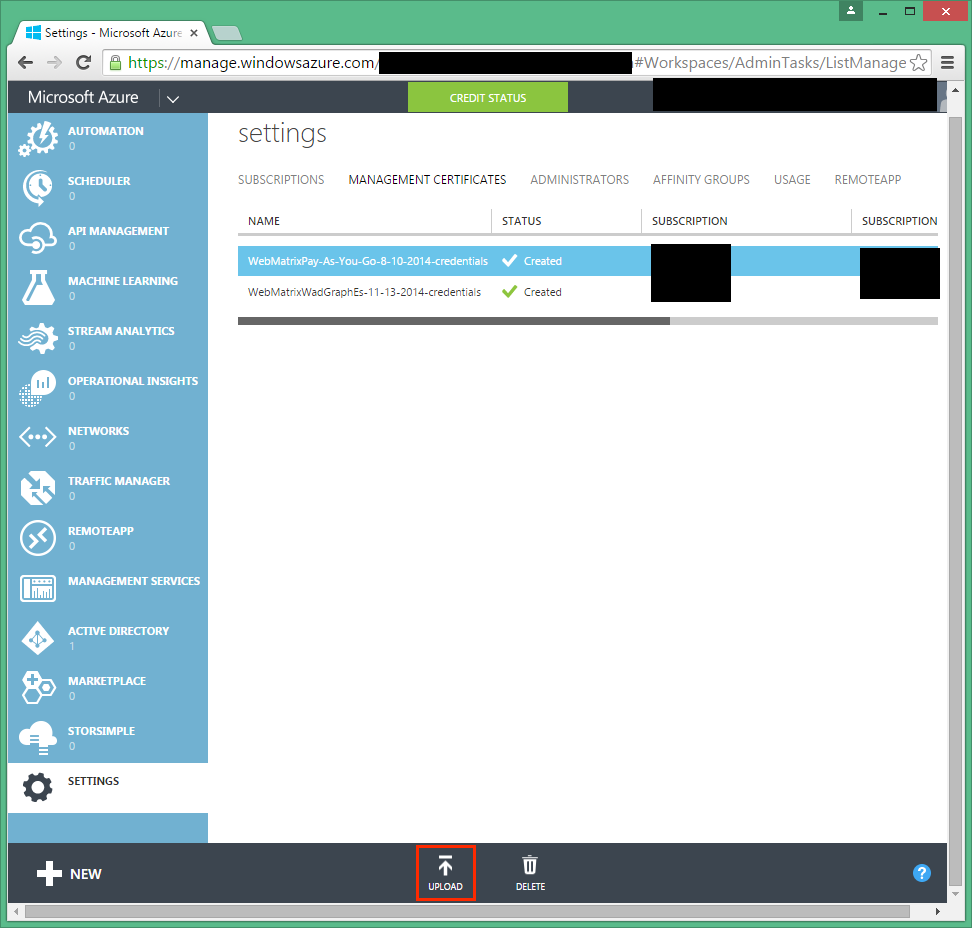
In the dialog pick the certificate you just created. If you have multiple Azure subscriptions, you'll be asked which subscription you want to upload the certificate for. When the upload completes copy the Subcription Id to the clipboard (it's in the Subcription Id column).
Please note management certificates allow you to do everything with your Azure subcription. Therefore, should your AzurePlot installation ever be compromised, remove the certificate from the portal so it can't be used for malicious goals.
Once you've completed this step, go back to AzurePlot and paste the subscription id:

Press the "Test configuration" button to test if everything works. If it does, it should print back the Subcription Name as it exists in Azure:
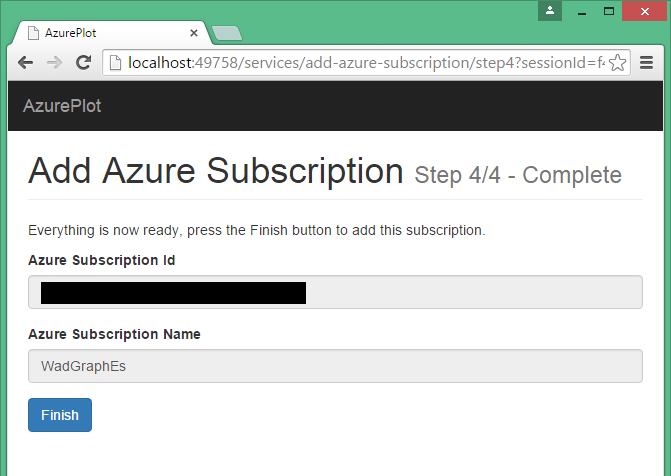
Now, press finish and you'll be done. The subscription should now be listed in the Service Overview screen:
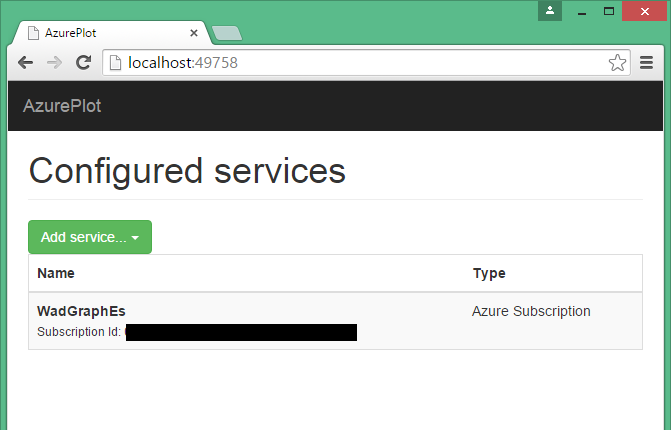
Once you've added the service, you can now go to the Dashboard screen to add charts.
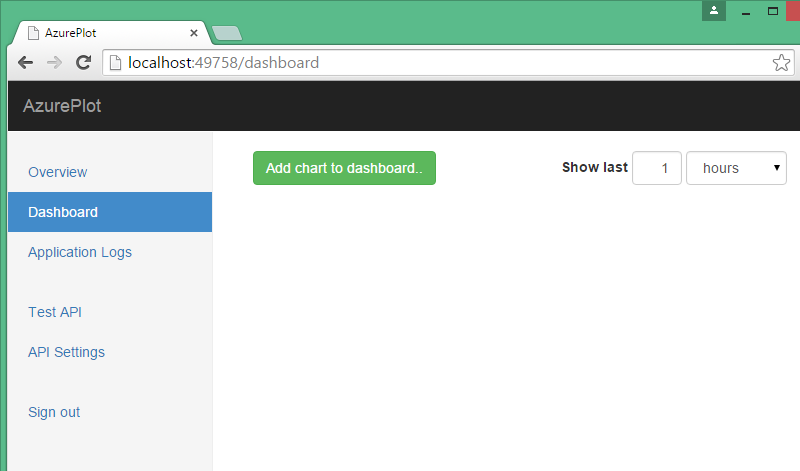
Press the "Add chart to dashboard" button. You'll be presented a dialog with a list of available charts available for your services.
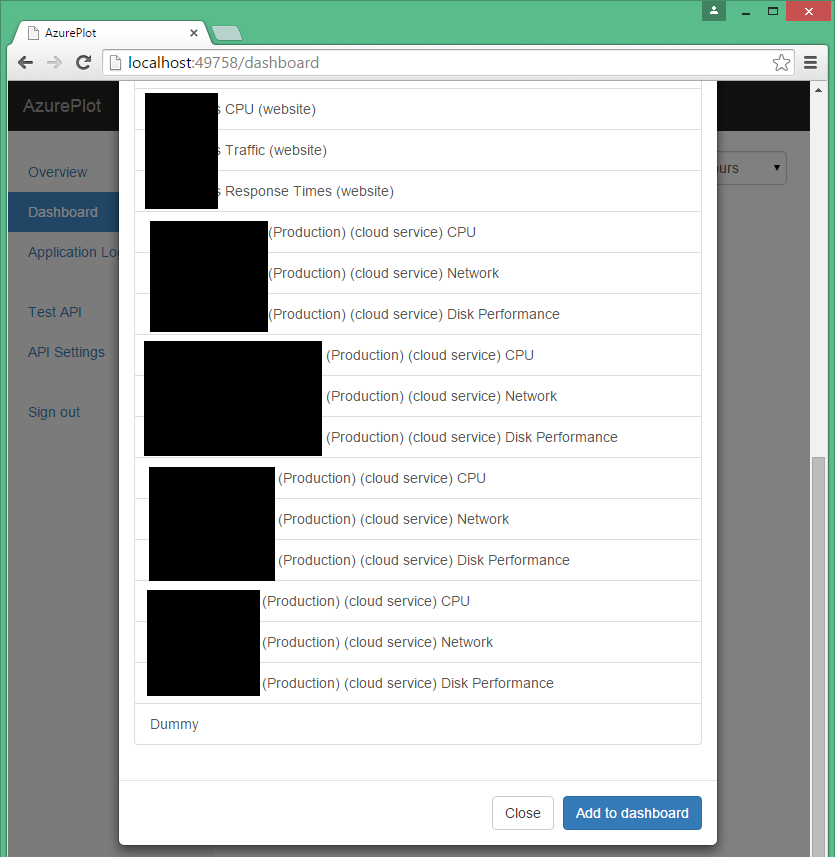
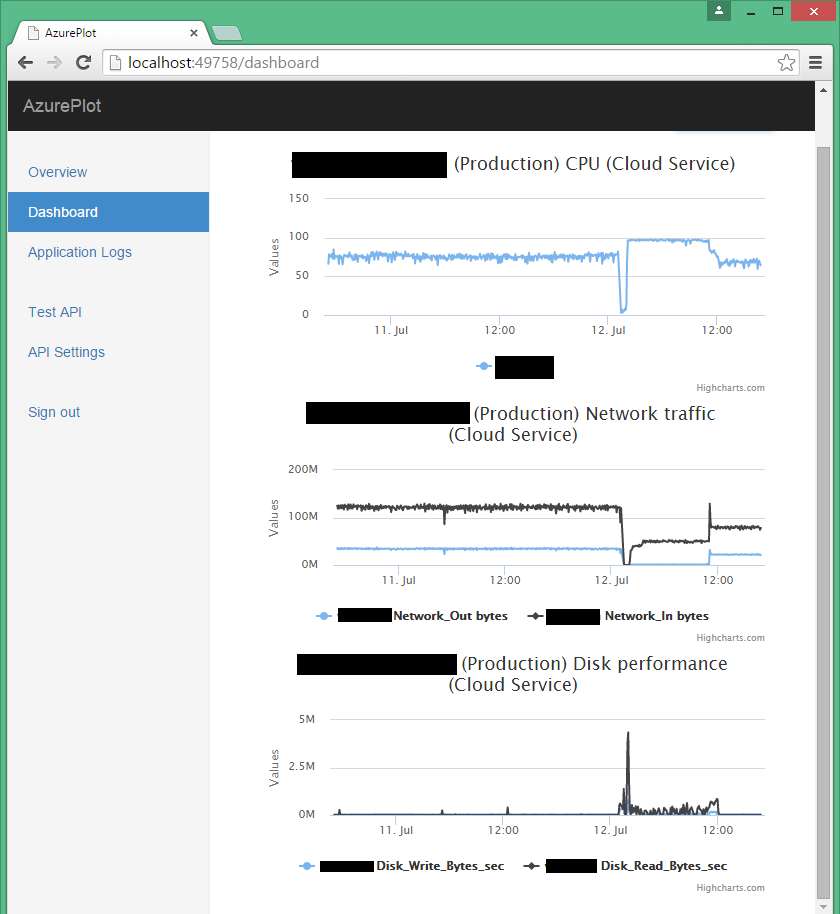
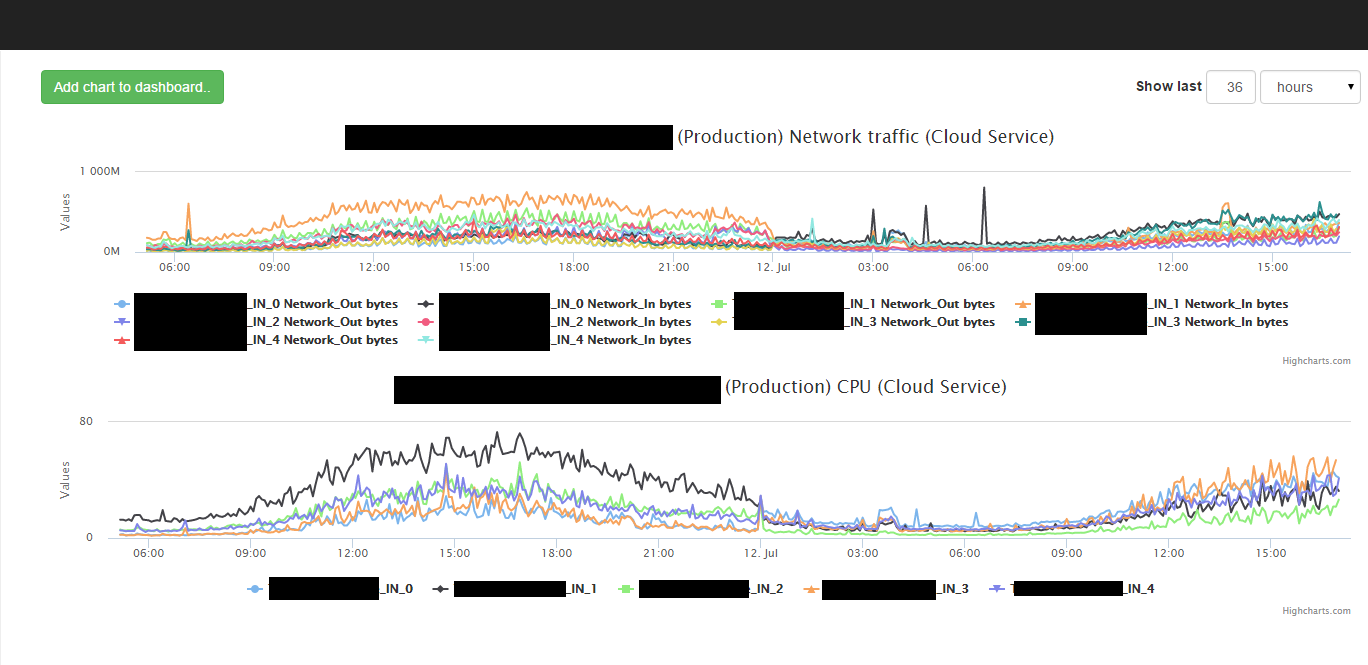
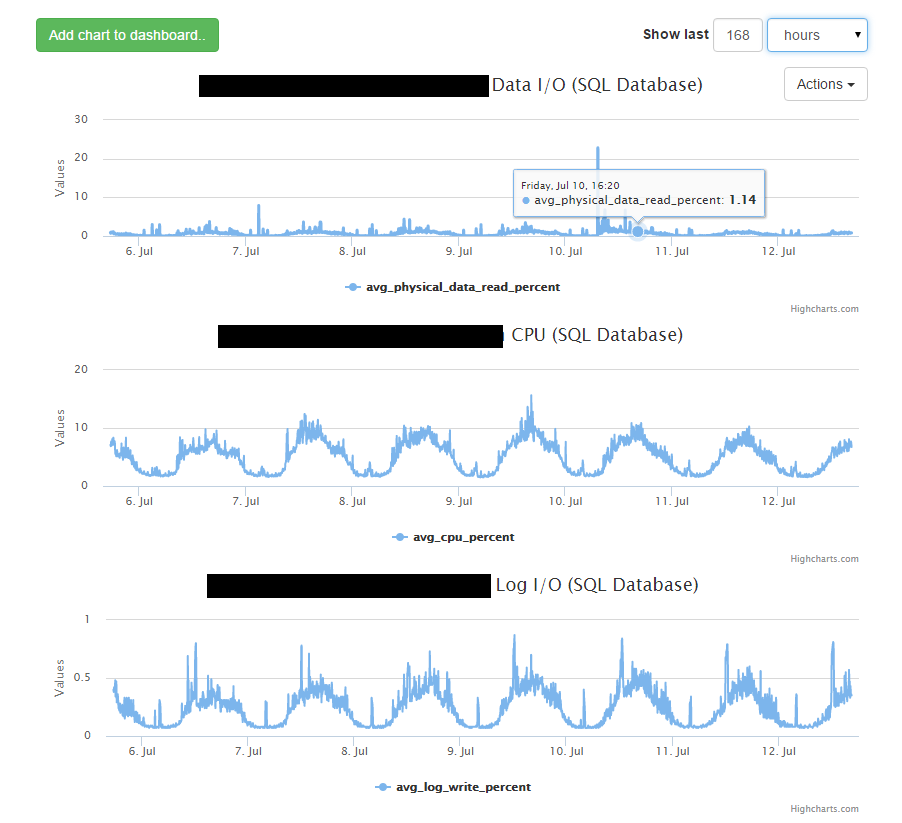
Click "Add to dashboard", and the charts will be added to your dashboard:
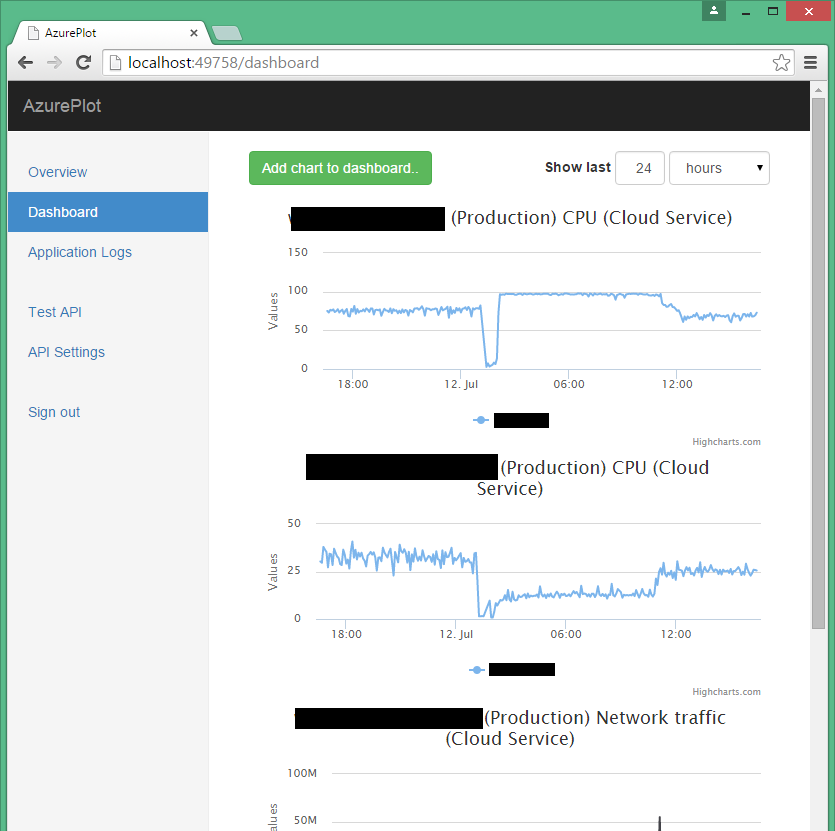
Congratulations, you've now added your first subscription to the dashboard.
We're working on:
- SQL V12 support
- SQL high resolution counts
- Cache API results for better performance
- Windows Azure Diagnostiscs performance counters
- Better chart manipulation
Please let us know if you have suggestions or like to contribute.
We heavily rely on other people's work, thank you for that. Specifically:
- Bootstrap
- Mono.Security
- Highcharts
- Using Azure Monitoring Service API with Azure Virtual Machines article
If I forgot yours, please drop me a note. Thank you!
This project can be used to feed WadGraphEs, a tool for monitoring you Azure powered applications.