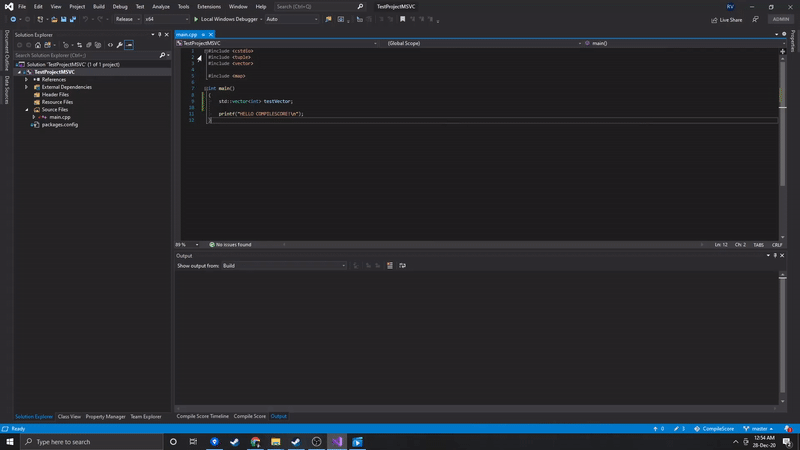
VisualStudio extension and utilities used to display and highlight compilation profiling data. Know the real compilation cost of your code directly inside Visual Studio. Keep the compile times in check.
Download latest VSIX from the Visual Studio Marketplace
Download latest Data Extractor Executable
Compile times are one of the most important things that affect productivity and iterations while developing in C/C++. Slow compile times can be very frustrating, as they are usual case scenarios in big code productions. Being able to identify which pieces are expensive in the same place you code is key in order to keep tech debt under control.
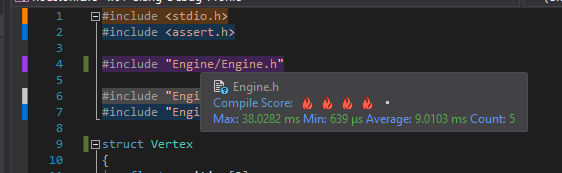
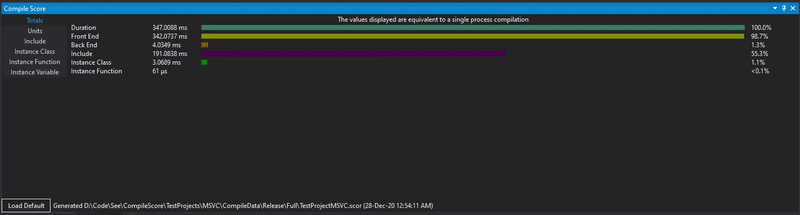
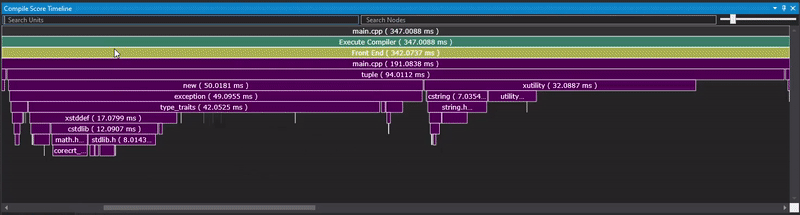
Double-click any entry in the compile score window to open its timeline.
Navigation controls:
- Zoom: Control + Mouse Wheel
- Scroll: Middle mouse press and drag
This repository also contains a standalone app with the same visualization and code as the VS extension. It can prove useful to compare results or open reports without having to open Visual Studio.
The app needs to be build. The solution can be found at CompileScore/WPF/CompileScoreWPF.sln.
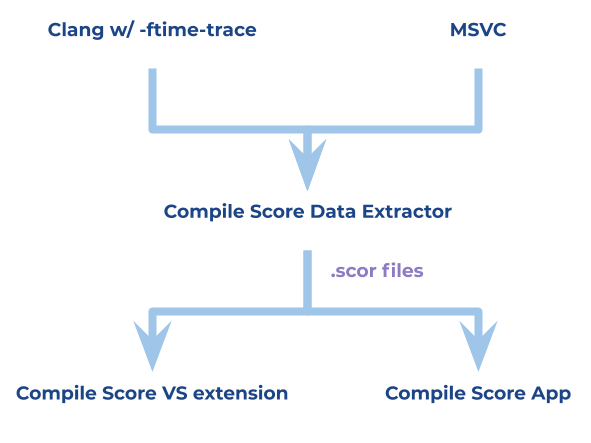
The main idea is to get the C++ compiler to output a trace for what happened during the build. We can then aggregate all that data using the Data Extractor in this repository, and consume it with the VS plugin or the standalone app.
The data extraction is an independent process in order to allow things like building the score file on a build server and consume it remotely. This can be useful in big codebases where we want the production floor to just use the reports from last night inside VS without having to profile locally.
In the VS extension options there is a field to tell the plugin where to find the report file (this is next to the solution file or root folder by default).
For more information check the Score Generation Page.
The Release workflow action contains a step by step process for building the Data Extractor, the VISX and the Standalone App.
Several Test Projects have been included in the repository.
- Visual Studio 2019
- Clang 9+ ( support for -ftime-trace )
- Microsoft C++ Build Insights SDK
If you're not using Visual Studio but are still interested in the data aggregation, you can use SeeProfiler, a standalone C++ compiler profiler which aggregates all the exported data from clang for a global view.
This project is open to code contributions.
If you found this extension useful you can always buy me a cup coffee.
