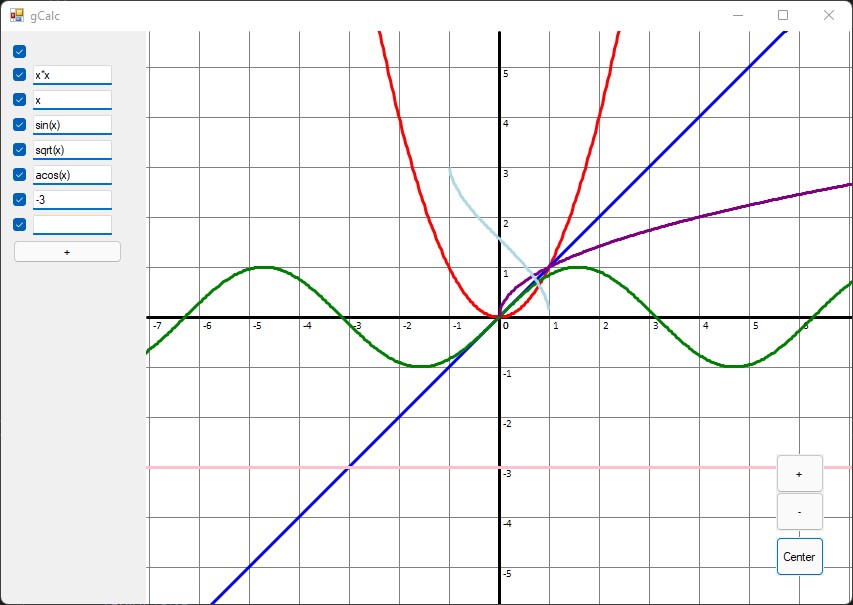
gCalc is a simple Graphing Calculator written in C# using WinForms. Compared to gCalc v1, this version is rewritten from the ground up with several key optimizations in mind.
- Performance. Plotting functions is almost instantaneous, and no longer slows down the UI if a complex function is being plotted.
- Unlimited Functions. Rather than being limited to 8 functions, you can now plot an arbitrary number of functions at the same time.
- Natural Scrolling/Zooming. Scaling and translation transformations are now applied about the cursor, rather than only the origin, evoking a much more natural feel.
Execution involves 3 major classes: Calculator, MainForm, and Buffer. For every function the user enters, a new Calculator thread is created. MainForm is primarily responsible for getting points from all the Calculator threads, and mapping the points to the screen before drawing them. The Buffer is an intermediary class that facilitates communication between the MainForm and Calculators.
Starting the application creates a MainForm, which immediately starts a Calculator thread and initial textbox to enter a function into, and the user can input as many functions as needed. Whenever the canvas needs to repaint, Main will collect any points that have been put in to the buffer, ignoring any functions that haven't completed yet. These points can't be drawn directly to the screen, though; Calculators calculate points in what I call function space. A coordinate in function space is (x, f(x)), where for any x value, a Calculator returns the result of applying that x value to its assigned function, f(x). In function space, the positive y axis extends upwards. However, we need to map these points to the screen, which I call screen space. A coordinate in screen space (x, y) is the pixel on the screen that corresponds to (x+a, y+b), where (a, b) is the top left corner of the canvas. In screen space, the positive y axis extends downwards. Clearly, plotting a function in function space as if it were a coordinate in screen space is not correct, as it would not take into account any zoom, offset, as well as the y-axis being flipped. The solution is to use linear algebra and matrices to map a point in function space to screen space.
Given a point (x, y) in function space, a scale factor of (sx, sy), and translation of (a, b), applying the following transformation results in a coordinate in screen space (x', y'):
After applying this to every point, the resulting array of points can be plotted to the screen using a single call to DrawLines(...).
This works well, but what if the user wants to scroll or zoom? Not only would it be inefficient to always recalculate the points, we also can't be guarenteed that a function will be finished calculating when we try to paint again after scrolling. The solution, again, is linear algebra and matrices. Whenever we plot a function's points, the Main thread stores the points (in screen space) that it just drew. If the user tries to scroll/zoom, we tell all the Calculators to start recalculating points, but in the meantime, apply the same transformations that we did to the origin/zoom level, etc., much like the transformation above. Since the Calculators are set to calculate some points that are a bit outside the current window, this gives us a buffer of points where we have something to draw on the screen as the user is moving around and transforming the canvas, and as each Calculator completes, we replace our approximations with the actual values. In theory, this is simple, but the hard part is figuring out what scale factor and translation is needed.
To translate a point (x, y) in screen space by (a, b), we apply the following transformation:
Note that this is the same as above, but with the scaling factors set to 1.
The simple case for zooming is about the origin, where we simply scale all the points normally. Given a point in screen space (x, y), the original scaling factor (sx, sy), and zoom in/out factor (fx, fy), we do:
But what if the mouse is somewhere other than the origin? We want the scaling to be about the mouse pointer, so that if you leave your mouse in the same place and zoom, your mouse will still be pointing at the same position in function space. To do this, we need to know where the mouse is pointing in function space, which is accomplished by inverting the transformation matrix before the matrix multiplication. Knowing this original coordinate in function space, we apply the scaling, and check where that coordinate would be in the new screen space. Then, all we have to do is to translate the canvas by the difference in those two points. Formally, given a point (x, y) in screen space, the original scale factor (sx, sy), the new scale factor (sx', sy'), the original origin position (a, b), and some change in origin position (delta x, delta y), the resultant point is calculated by the following transformation:
Last, the Main thread is also responsible for drawing the X-Axis, Y-Axis, and all grid lines on the canvas. The axes are rather straightforward; map the origin point from function space to screen space, and use those values to plot two line across the screen. For the grid lines, we look at the domain and range of the screen to determine which power of 10 is most appropriate to display (i.e. if the window is from [-50, 60], 10^1=10 is the appropriate gap between grid lines). At the same time, labels are also drawn for each grid line.
When a Calculator is created, its thread blocks until it receives a valid function from the Buffer (since the block is implemented using a semaphore rather than busy waiting, this is efficient). Upon receiving a function, the Calculator starts calculating points within the domain of the screen. Once the the calculations are completed, the points are sent back to the Buffer, and the Main thread is notified that the specified function is completed. If the Calculator encounters an error while evaluating the function, we assume there was an error with how the function was inputted, so the thread blocks until it receives a new function to evaluate. Upon completing its calculations, a Calculator thread will block until it receives a signal (via another semaphore) from the Main thread that the points it calculated are no longer valid, indicating that new points are needed, and the process repeats.
Buffer stores any data that is shared between the Calculators and Main thread. This includes things like the current scale factor, the domain and range of the window (in function space), and the points that have been calculated by each Calculator thread.
Let's recap by seeing how the design and implementation of gCalc v2 addresses the key points laid out in the introduction.
- Performance. In the original version of gCalc, all execution was done on the Main Thread, which is inefficient for obvious reasons. In particular, the UI was not able to update while points were being calculated, which lead to the interface being laggy, especially when complex functions were being drawn, or at a high resolution. As well, this meant that each function's points were calculated in series, and at times you could even see the functions being plotted one after another. The solution was to split the execution into different threads. Since UI updates are decoupled from the points being calculated, no matter what function you enter, the interface remains responsive.
- Unlimited Functions. Splitting execution into threads means that scaling from one function to hundreds is almost trivial, allowing the user to input as many functions as they want. Even as execution slows down, since we cache the most recently drawn points, transformations on the canvas, even with lots of functions, is still quite performant, especially in comparson to gCalc v1, even when limited to it maxium of 8 functions.
- Natrual Scrolling/Zooming With the advent of natural scrolling on smartphones and computers, users expect scrolling and zooming to act a particular way. It's quite hard to get things feeling right, but its also very easy to tell when things are wrong. A large portion of this project was devoted to getting these transformations to feel right, and while there are certainly improvements to be made, it is much better than the transformations that were locked about the origin in its predecessor.
Since this project was mostly just a fun side project, it is far from feature complete. Here are a just a few limitations:
- Only functions with respect to x are able to be graphed; multivariable equalities (such as the equation of a circle, x^2+y^2=r^2) are not valid
- Parsing equations from text is done via the NCalc 2 library, which has some limitations:
- It's pretty slow
- The exponent (^) operator doesn't work
- Inertial dragging (i.e. if you drag with enough speed, the graph should continue scrolling for a bit, with some amount of friction)
- The main UI should really be rewritten as a WPF form instead of WinForms