This is an Open Source SVG (Scalable Vector Graphics) Charts for Blazor and WebAssembly. It uses C#, HTML and CSS with minimal Javascript dependencies.
#elegantlysimple
v0.1

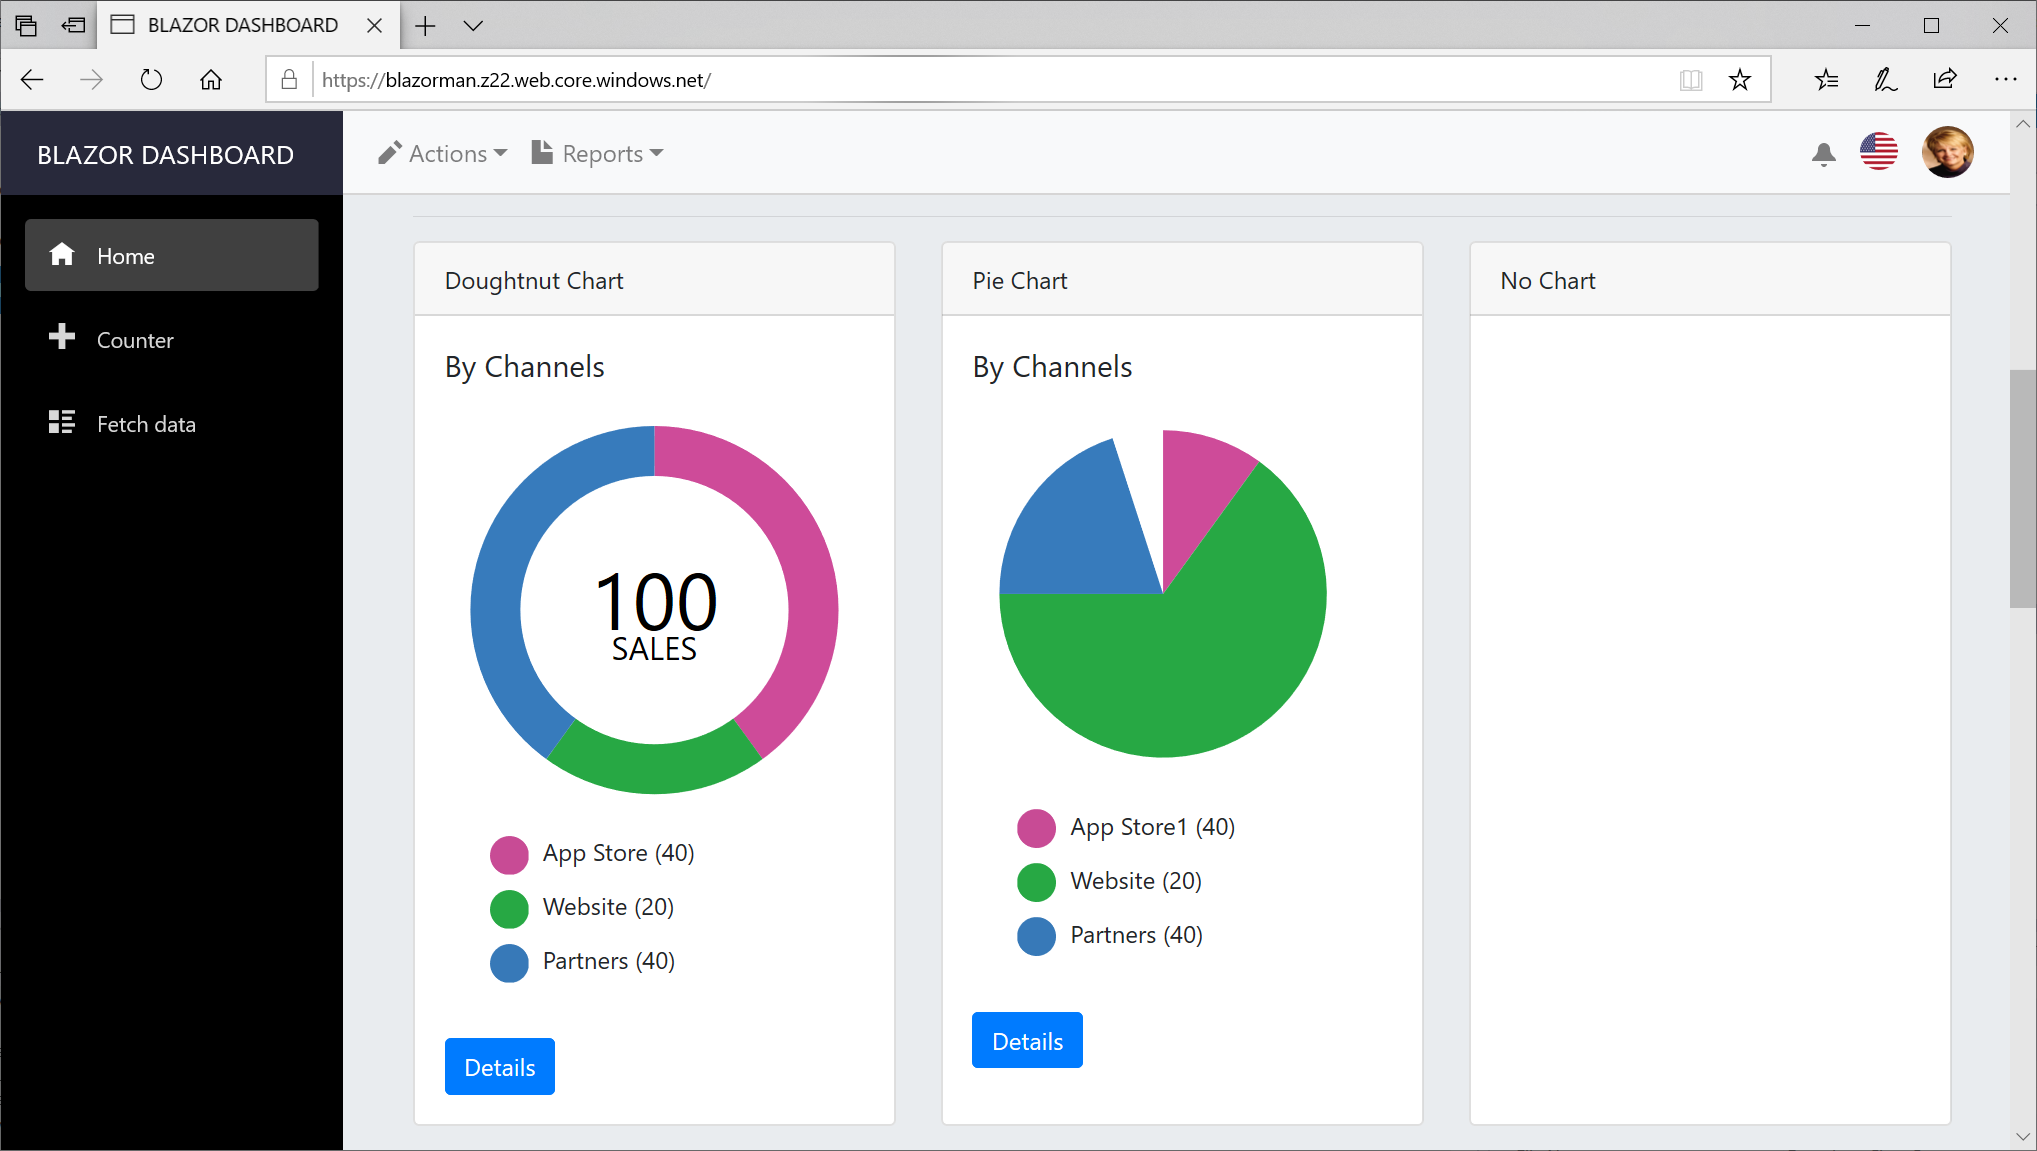
To use the Donut Chart
<DonutChart InputData="10,30,20,10,10,10,5,5" InputLabels="App Store,Website,Partners,Direct,Channels,Retail,Distributors,Affiliates" PrimaryText="150" SecondaryText="Sales"> </DonutChart>
https://www.webassemblyman.com/blazor/blazordonutchart.html
To use the Pie Chart
<PieChart InputData="10,30,20,10,10,10,5,5" InputLabels="App Store,Website,Partners,Direct,Channels,Retail,Distributors,Affiliates"> </PieChart>
https://www.webassemblyman.com/blazor/blazorpiechart.html
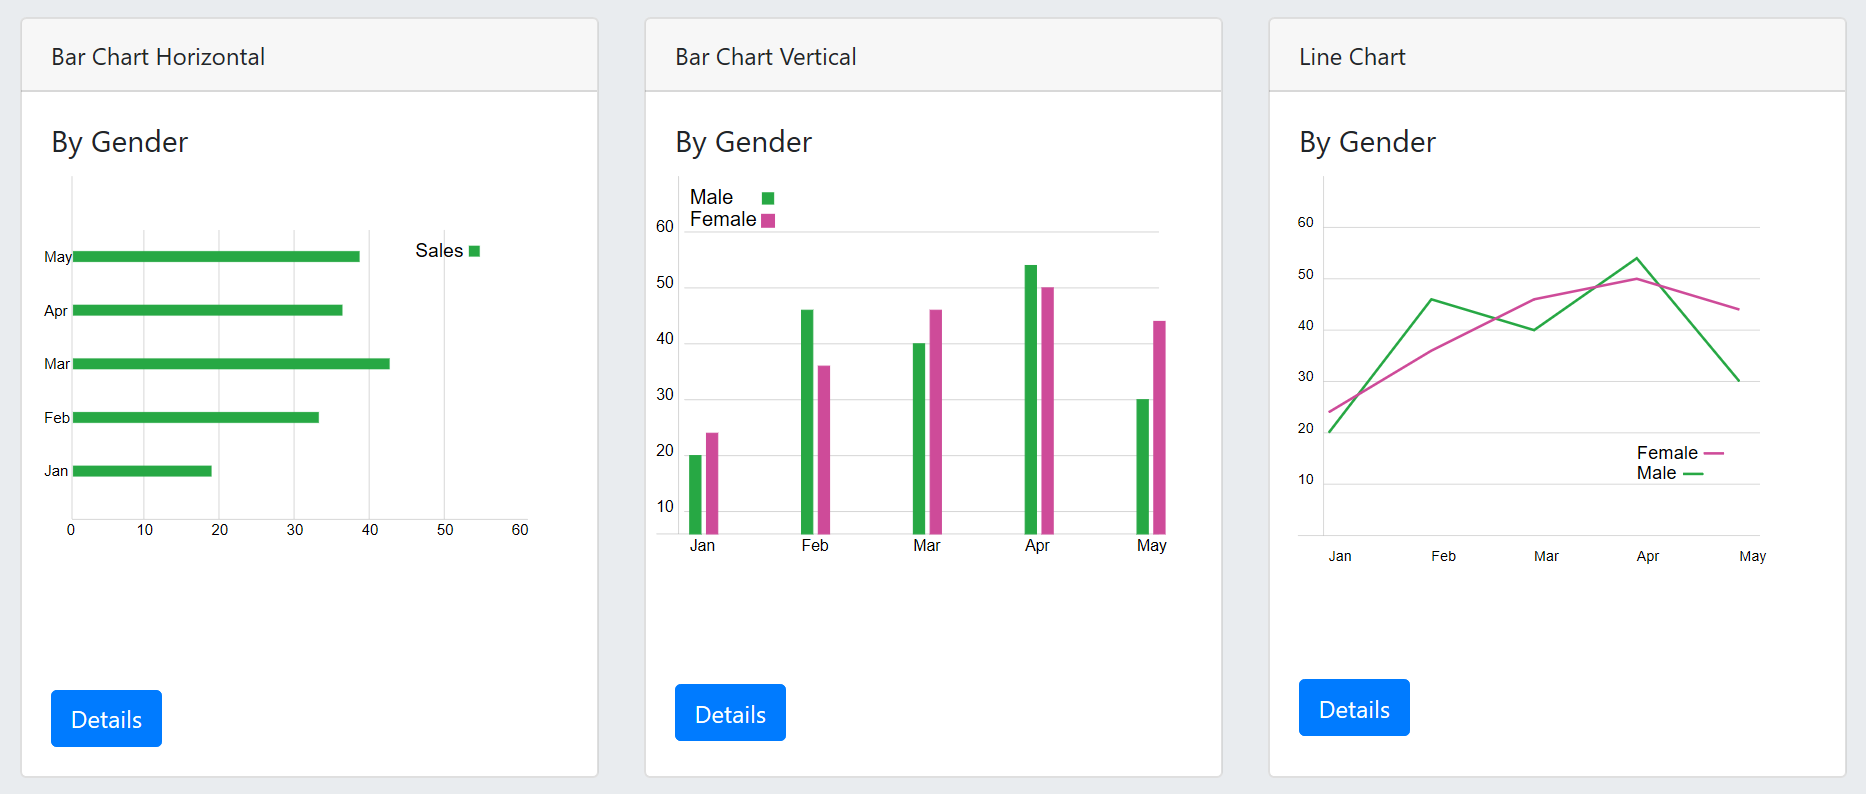
To use the Horizontal Bar Chart
<HorizontalBarChart InputData="10,20,30,40,50,60,70,80,90,100" InputLabels="App Store,Website,Partners,Direct,Channels,Retail,Distributors,Affiliates,Phone,TV"> </HorizontalBarChart>
To use the Vertical Bar Chart
<VerticalBarChart InputData="30,70,42,50,3,55,35,22,10,5" InputLabels="App Store,Website,Partners,Direct,Channels,Retail,Distributors,Affiliates,Phone,TV"> </VerticalBarChart>
https://www.webassemblyman.com/blazor/blazorbarchart.html
To use the Line Chart
<LineChart InputData="[30,70,42,50,3,55,35,22 ],[40,50,32,70,55,15,15,12],[0,10,10,10,10,20,70,70]" InputLabels="App Store,Website,Partners"></LineChart>
Please also check out our Elegantly Simple Misfits-Rebels-Outcasts/Blazor-Dashboard that goes hand-in-hand with our Blazor Charts.