By hand crafting this reinforcement learning algorithm I better understood the method and have a deep intuition of it, recognizing how it can be applied into future projects.

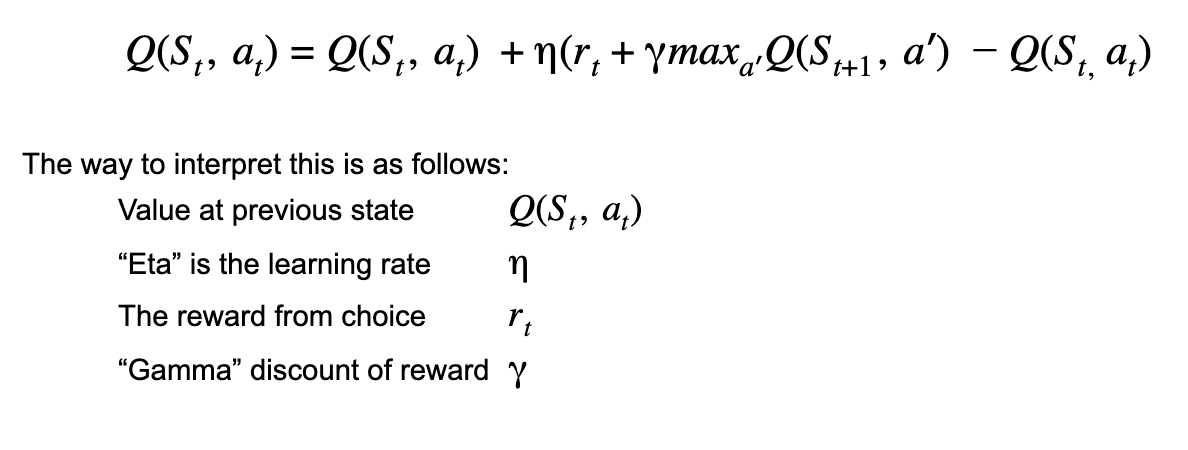
That value that gets stored into (continuing the example from above) in coordinate (“12221”, North) would be the reward value as input into the Bellman’s equation, which is as follows:

Robby first examines the five tiles around him, North, South, East, West, and Center (just under him). He examines what exists within those squares and stores the results in a string: * 0 is a cliff * 1 is an empty tile floor * 2 is a can

Robby first examines the five tiles around him, North, South, East, West, and Center (just under him). He examines what exists within those squares and stores the results in a string:
This example in results in which Robby would scan and record his scenario here would be: North=1, South=2, East=2, West=2, and Center=1. This would result in the string “12221” which would then act at the appropriate row to store the information, after he moves. The intuition of the Q learning table is that Robby records the results of his resulting situation in the state in which he moved from, as opposed to his current state that he just walked into. If he were to select the action “North” and move upwards one square (which would result in the state space as “01121” then he would record his reward findings into the previous state space which was “12221” and in the column “North”.
Robby gets 0 points for walking, -1 for attempting to pick up a can when one doesn’t exist, -5 for falling down a cliff, and +10 for successfully picking up a can.


After 1000 episodes, Robby received an average reward of -125 points with a standard deviation of 696 points for the first half, and -89 reward points with a standard deviation of 367 for the second 500 episodes. Though the plots on the second half seem at a glance to be more scattered they are actually much more condensed. The second graph has the worst result being -5747 points, while the first half has a worst scenario of -19936 points in a single episode. The tightened standard deviation in the second half as well as the significantly higher average score does show that Robby is learning from his experience.

The absolute best scenarios happened when the epsilon was around 0.04 for the first half, and 0.02 on the second.

while running the simulator, if you notice that everything is all cluttered together, just click the full screen mode button on the bottom.
Select the initial board width and depth by clicking on the box, type in the information you want, then click outside of the box to enter the data. Do the same with Number of Episodes.
If you notice that the start button is greyed out, that means you have some non-numerical text in the text boxes. Change that text into a numerical text and you’ll notice that the Start button becomes white and clickable.
Once you’re ready you can hit the Start button. Press the ‘r’ key (without shift) to restart the simulation and record the points on the graph.
There are two graphs, one that represents Robby’s performance while he is training, (the first round of the episodes) and then again the second time with the same round of the same amount of maximum episodes set by the user. The first half will record in the top “Training” graph while the second will be recorded in the bottom graph “Trained”. This will show both the average reward points and standard deviations.